Introducing: expo-MAX Heat Maps Introducing: expo-MAX Heat Maps
In the interest of furthering the all-in-one website optimization capabilities of expo-MAX Real Analytics,
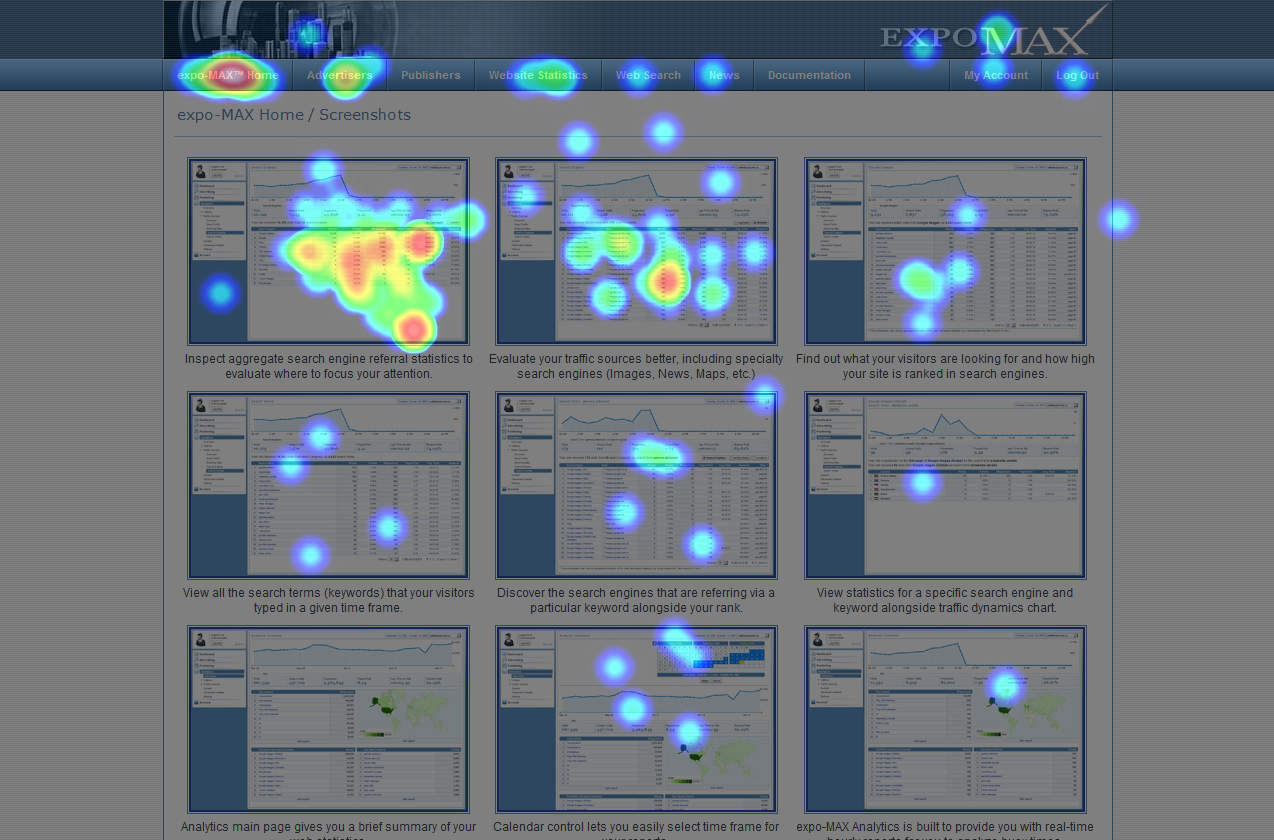
we’ve added an exciting new feature: expo-MAX Heat Maps. Heat maps is a powerful visual tool that allows you
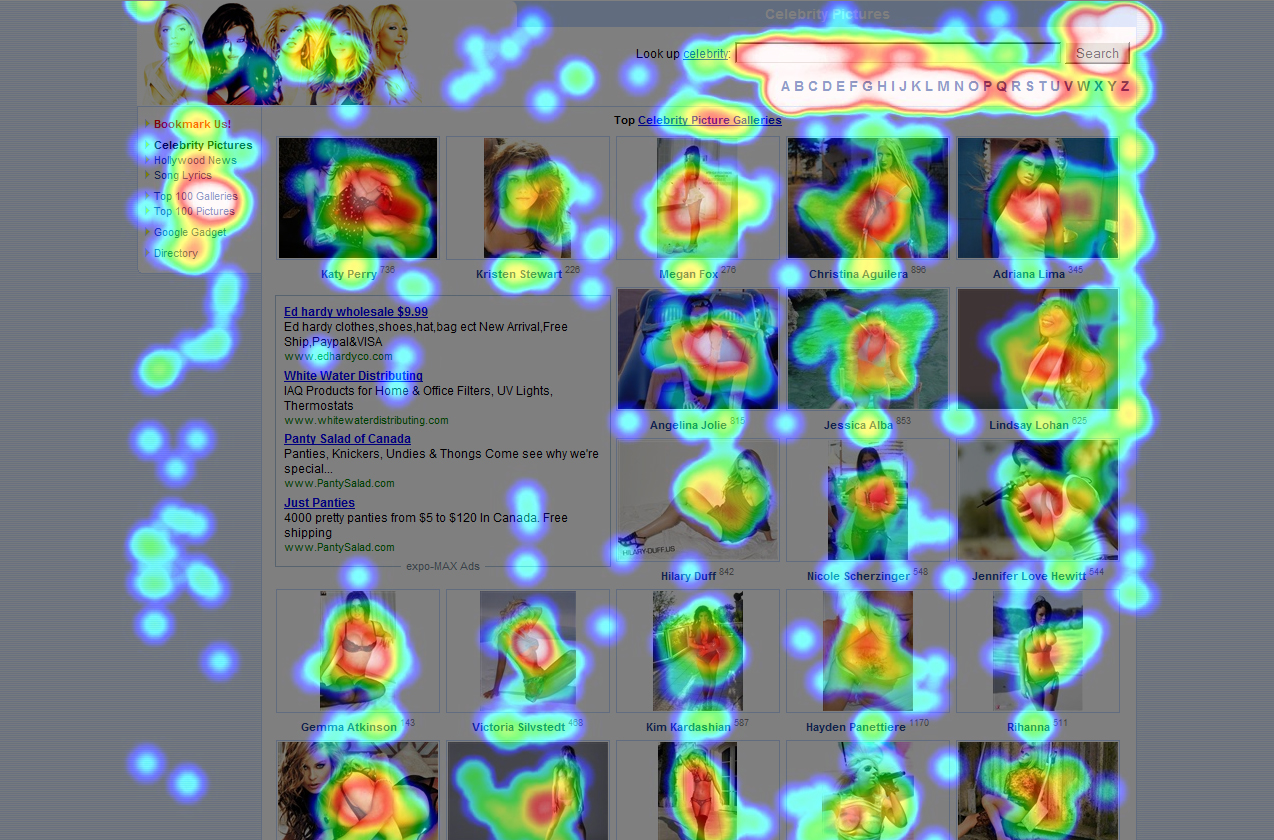
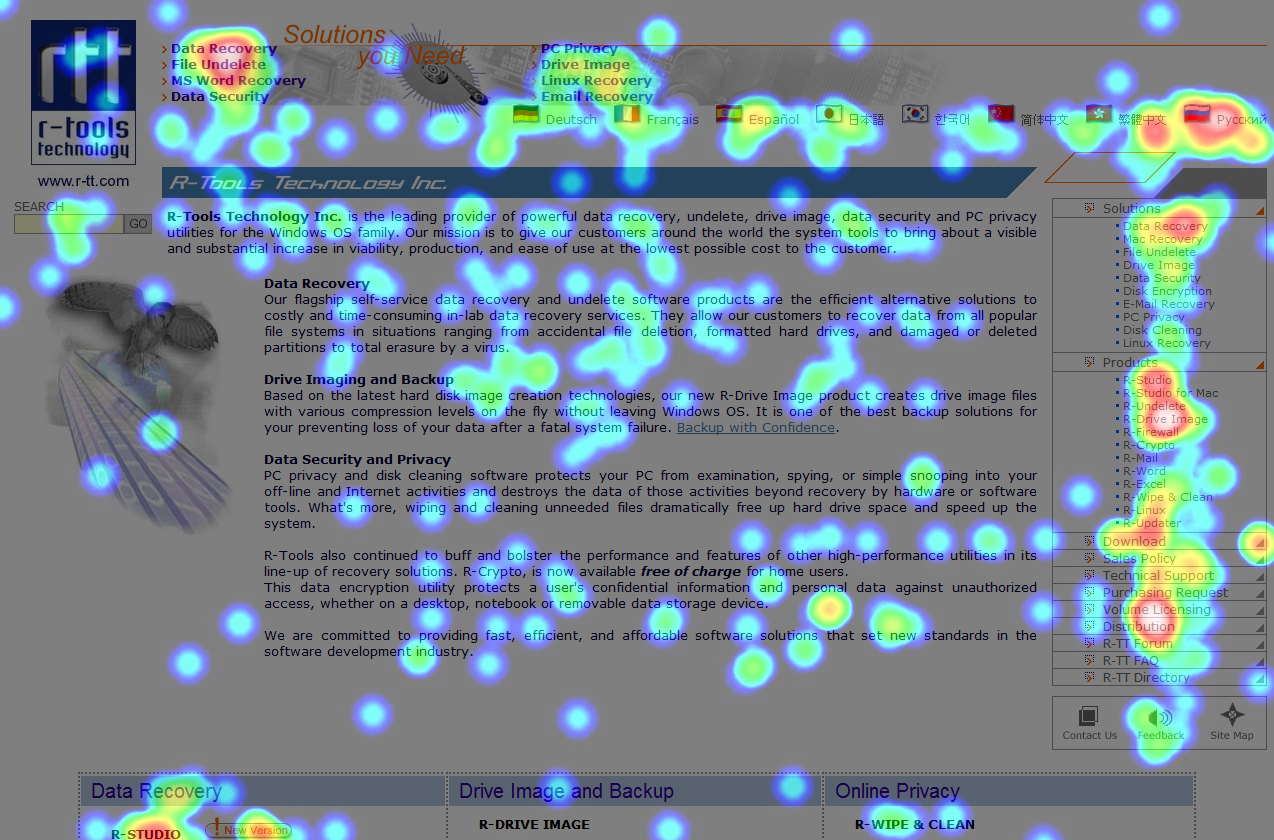
to see the areas on your website where your visitors click the most. Heat Maps automatically detects where
visitors click on each of your pages so you can identify the areas that receive the most attention. With
information, you can:
|
Use our automatically generated Heat Maps to determine areas frequently scanned by your visitors.
|
Improve your click through rate (CTR) and ad revenue by maximizing ad visibility.
|
Our Heat Maps can be calibrated for both fixed-width and stretchable website layouts.
|
Maximize ad visibility. Discover prime real estate for your advertisements to boost your click through
(CTR) and increase your ad revenue.
Understand what interests your readers. Find out what catches your reader’s eye and build upon your
prior successes.
Optimize site design. Make your pages more user-friendly by anticipating where they’ll click next.
Repurpose underperforming ads and elements. Shed light on “dead space” on your page that rarely
receives clicks and move your high earning ads to a more profitable location.
Much market analysis and research has been conducted using heat maps, serving as the basis for many web
design and ad placement conventions and best practices. With expo-MAX Real Analytics Heat Maps, you can
take these generalized principles and tailor them specifically to your website. Each website and page is
unique, and by creating your very own Heat Map, you can get the most mileage out of this powerful
analytical technology. Heat Maps lets you visualize your visitors, making it an excellent complement
to the in-depth reporting also included in expo-MAX Real Analytics. You can follow up on your findings
by drilling down deeper by analyzing your Top Content, Exit Pages, Top Referrers and other visitor
activity.
If you have expo-MAX Real Analytics installed on your website, then we’ve already been generating Heat
Maps for your pages. Simply click Content and choose Heat Maps to see the data pertaining to each one
of your pages. You can make our Heat Maps even more accurate by calibrating your website. Heat Maps
works for both fixed-width and stretchable website layouts. Just let expo-MAX Real Analytics know how your
website is laid out to get the most accurate readouts and click distributions.
expo-MAX Real Analytics Heat Maps helps you understand what’s hot and what’s not on your website. Heat Maps
is an excellent feature for blogs, e-commerce, lead generation and content network sites. Building a better
website is all about understanding your visitors—and with Heat Maps, you get even more insight into how your
visitors interact with the elements on your web pages.
|
|
 | Sign Up Now |  |
|
|
|